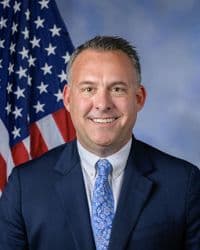
U.S. Representative
Adam Gray
California District 13
DemocratModerate Liberal
Contact
U.S. Representative
California District 13
Contact
Voting Profile
Most Active Policy Areas
6
Votes Analyzed
Data sources: voteview, congress.gov
Political Position
Based on his voting record, Adam Gray positions himself as a moderate within the Democratic Party, with an ideology score that is more conservative than the average House Democrat. His voting pattern suggests he may represent a swing district or hold more centrist views on certain issues.
More conservative than the average Democrat (-0.38)
Data source: VoteView NOMINATE scores (UCLA/UC San Diego)
Policy Positions
6
total votes analyzed
Overview
Adam Gray is a newly-elected Democratic Representative from California serving in the U.S. House. With only six votes on record, he is in the earliest stages of establishing his legislative record. His voting pattern thus far shows alignment with Democratic procedural positions, voting against Republican-led procedural motions while supporting Democratic alternatives. His NOMINATE score of -0.235 places him in the moderate liberal range, notably more centrist than the average House Democrat at -0.380. As a freshman member, Gray's full policy priorities and legislative focus areas are still emerging. His positioning suggests he may seek to bridge partisan divides on certain issues while maintaining core Democratic positions.
Key Positions
By Policy Area
Analysis updated: January 9, 2026
Campaign Finance
Includes all authorized campaign committees (principal committee, joint fundraising, and other authorized committees). Outside spending by Super PACs and independent groups is shown separately below. Verify on FEC.gov →
Career: $13.0M
Fundraising Over Time
Contribution Sources
66%
34%
0%
Individual Breakdown
Itemized (>$200)
$1.9M
Small Dollar (<$200)
$482K
Donation Sizes
Share of individual contribution dollars by donation size, current election cycle.
Where the Money Comes From
Itemized individual contributions only (donations over $200 report the donor's state). Small-dollar donations are not included because the FEC does not itemize them.
Top Contributors
Top Contributing Industries
Top Donor Employers
Employer as self-reported by itemized donors. “Not Employed” and “Self-Employed” typically rank highest for small-dollar campaigns and include retirees.
Where the Money Goes
Spending by Purpose
Purpose categories are self-reported on FEC filings; large “Other” totals are common.
Top Payees
AMERICAN EXPRESS
OVERLAND STRATEGIES LLC
MOLLY ALLEN ASSOCIATES LLC
GUSTO
SB DIGITAL, INC.
BERGER HIRSCHBERG STRATEGIES
GREENBERG TRAURIG LLP
SPIROS CONSULTING
Detailed Breakdown
Expenditures
Operating Costs
$2.2M
Operating Offsets
$5K
Net Operating
$2.2M
Refunds
Individual Refunds
$29K
Committee Refunds
$15K
Outside Spending (Super PACs)
Supporting
$5.0M
Opposing
$18.1M
Total Outside Spending
$23.0M
Top Outside Spenders
CONGRESSIONAL LEADERSHIP FUND
NRCC
NATIONAL ASSOCIATION OF REALTORS CONGRESSIONAL FUND
HMP
SOMOS PAC
SD PAC
CAL FREEDOM PAC (MULTI-CANDIDATE CMTE)
CALIFORNIA REAL ESTATE POLITICAL ACTION COMMITTEE/FEDERAL - CALIFORNIA ASSOCIATION OF REALTORS
Independent expenditures are made without coordination with the candidate. Source: FEC Schedule E filings.
Voting Record
3 votes across 1 categories