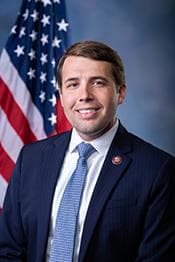
U.S. Representative
Chris Pappas
New Hampshire District 1
DemocratModerate Liberal
Contact
U.S. Representative
New Hampshire District 1
Contact
Voting Profile
Most Active Policy Areas
49
Votes Analyzed
Data sources: voteview, congress.gov
Political Position
Chris Pappas is a moderate liberal Democrat whose voting record places him somewhat to the right of the average House Democrat. His NOMINATE score of -0.234 reflects a center-left approach that occasionally diverges from his party's more progressive wing, consistent with representing a competitive swing district in New Hampshire.
More conservative than the average Democrat (-0.38)
Data source: VoteView NOMINATE scores (UCLA/UC San Diego)
Policy Positions
49
total votes analyzed
Overview
Chris Pappas represents New Hampshire in the U.S. House as a Democrat who has carved out a moderate position within his party. His voting pattern suggests a pragmatic approach that balances Democratic priorities with the preferences of his politically competitive district. Based on available voting data, Pappas has been active on healthcare legislation, voting in favor of related measures approximately two-thirds of the time. He has also supported defense-related bills consistently, showing 100% support in that category, which aligns with his positioning as a moderate Democrat. His budget votes show a more mixed pattern, with 56% support, suggesting he may exercise independent judgment on fiscal matters rather than following a strict party line. This approach is typical of representatives from swing districts who must balance party priorities with constituent concerns.
Key Positions
By Policy Area
Analysis updated: January 9, 2026
Campaign Finance
Includes all authorized campaign committees (principal committee, joint fundraising, and other authorized committees). Outside spending by Super PACs and independent groups is shown separately below. Verify on FEC.gov →
Career: $14.7M
Fundraising Over Time
Contribution Sources
68%
32%
0%
Individual Breakdown
Itemized (>$200)
$2.5M
Small Dollar (<$200)
$259K
Donation Sizes
Share of individual contribution dollars by donation size, current election cycle.
Where the Money Comes From
Itemized individual contributions only (donations over $200 report the donor's state). Small-dollar donations are not included because the FEC does not itemize them.
Top Contributing Industries
Top Donor Employers
Employer as self-reported by itemized donors. “Not Employed” and “Self-Employed” typically rank highest for small-dollar campaigns and include retirees.
Where the Money Goes
Spending by Purpose
Purpose categories are self-reported on FEC filings; large “Other” totals are common.
Top Payees
MIDDLE SEAT
PAYROLL DATA PROCESSING
QCT PRODUCTION
FULKERSON, KENNEDY & COMPANY
ACTBLUE TECHNICAL SERVICES
GREENBERG QUINLAN ROSNER RESEARCH INC.
THE FROST GROUP
MISSIONWIRED
Detailed Breakdown
Expenditures
Operating Costs
$3.7M
Net Operating
$3.7M
Refunds
Individual Refunds
$4K
Outside Spending (Super PACs)
Supporting
$1.2M
Opposing
$12.7M
Total Outside Spending
$14.0M
Top Outside Spenders
NRCC
CONGRESSIONAL LEADERSHIP FUND
EQUALITY PAC
FREEDOM'S FUTURE FUND INC.
CULAC THE PAC OF CREDIT UNION NATIONAL ASSOCIATION
NEXTGEN CLIMATE ACTION COMMITTEE
PROGRESSIVE TURNOUT PROJECT
NH FREEDOM FUND, INC.
Independent expenditures are made without coordination with the candidate. Source: FEC Schedule E filings.
Voting Record
46 votes across 6 categories