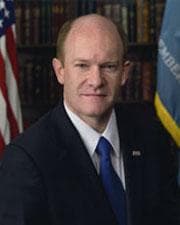
U.S. Senator
Christopher A. Coons
Delaware
DemocratModerate Liberal
Contact
U.S. Senator
Delaware
Contact
Voting Profile
Most Active Policy Areas
224
Votes Analyzed
Data sources: voteview, congress.gov
Political Position
Senator Coons positions himself as a moderate liberal within the Democratic Party, with a voting record that leans left of center but is notably more conservative than the average Democrat. His NOMINATE score of -0.238 suggests he often seeks middle-ground positions and may be more willing to work across party lines than many of his Democratic colleagues.
More conservative than the average Democrat (-0.38)
Data source: VoteView NOMINATE scores (UCLA/UC San Diego)
Policy Positions
224
total votes analyzed
Overview
Christopher Coons has served Delaware in the U.S. Senate as a Democrat who frequently occupies the moderate wing of his party. His voting patterns suggest a pragmatic approach to legislation, particularly on issues of defense, environment, and financial regulation. On healthcare, Senator Coons has cast 126 votes with a 59% rate of voting in favor of measures brought before the chamber, indicating engagement with the issue while not being a reflexive supporter of all healthcare-related legislation. His strong support in banking and finance votes (100% yea on 6 votes) and environmental/energy issues (70% yea) suggests particular focus on these areas. His defense voting record shows 73% support for measures in that category, which is consistent with his reputation as a more defense-friendly Democrat. On fiscal matters including budget and agriculture, his voting record shows more restraint, with 0% yea votes in both categories during the period measured.
Key Positions
By Policy Area
Analysis updated: January 9, 2026
Campaign Finance
Includes all authorized campaign committees (principal committee, joint fundraising, and other authorized committees). Outside spending by Super PACs and independent groups is shown separately below. Verify on FEC.gov →
Career: $23.9M
Fundraising Over Time
Contribution Sources
63%
37%
Individual Breakdown
Itemized (>$200)
$3.4M
Small Dollar (<$200)
$184K
Donation Sizes
Share of individual contribution dollars by donation size, current election cycle.
Where the Money Comes From
Itemized individual contributions only (donations over $200 report the donor's state). Small-dollar donations are not included because the FEC does not itemize them.
Top Contributors
Top Contributing Industries
Top Donor Employers
Employer as self-reported by itemized donors. “Not Employed” and “Self-Employed” typically rank highest for small-dollar campaigns and include retirees.
Where the Money Goes
Spending by Purpose
Purpose categories are self-reported on FEC filings; large “Other” totals are common.
Top Payees
FULKERSON, KENNEDY & CO.
PAYROLL MANAGEMENT ASSISTANCE
GPS IMPACT
FIRST NATIONAL BANK OF OMAHA
CAPITOL COMPLIANCE ASSOCIATES, INC.
JBW CONSULTING, LLC
HARBOR LIGHT STRATEGIES LLC
DEMOCRATIC STATE COMMITTEE (DELAWARE)
Detailed Breakdown
Expenditures
Operating Costs
$2.9M
Operating Offsets
$5K
Net Operating
$2.9M
Refunds
Individual Refunds
$35K
Committee Refunds
$15K
Outside Spending (Super PACs)
Supporting
$38K
Opposing
$315K
Total Outside Spending
$353K
Top Outside Spenders
NATIONAL RIFLE ASSOCIATION OF AMERICA POLITICAL VICTORY FUND
FIRST AMENDMENT ALLIANCE
LET FREEDOM RING INC
AMERICAN WORKER INC, THE
THE NATIONAL REPUBLICAN TRUST PAC
NARAL Pro-Choice America
OUR COUNTRY DESERVES BETTER PAC - TEAPARTYEXPRESS.ORG
CARE ACTION
Independent expenditures are made without coordination with the candidate. Source: FEC Schedule E filings.
Voting Record
155 votes across 12 categories