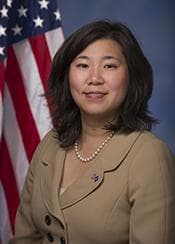
U.S. Representative
Grace Meng
New York District 6
DemocratProgressive
Contact
U.S. Representative
New York District 6
Contact
Voting Profile
Most Active Policy Areas
103
Votes Analyzed
Data sources: voteview, congress.gov
Political Position
Representative Grace Meng holds a progressive voting record with an ideology score of -0.370, placing her slightly to the right of the average House Democrat (-0.380). Her voting pattern aligns closely with mainstream Democratic positions while occasionally showing modest departures from the party's left wing.
Near the average for Democrats (-0.38)
Data source: VoteView NOMINATE scores (UCLA/UC San Diego)
Policy Positions
103
total votes analyzed
Overview
Grace Meng represents New York in the U.S. House of Representatives and has compiled a voting record across 103 recorded votes that spans multiple policy areas. Her most active area of voting has been healthcare, where she has cast 67 votes with a 48% rate of voting in favor of the measures presented. Her voting pattern on procedural matters shows consistent opposition to Republican-led procedural motions, such as ordering the previous question and agreeing to resolutions, while supporting Democratic procedural alternatives like motions to recommit with instructions. This reflects typical partisan positioning on House floor procedures. In fiscal matters, Representative Meng has shown a slightly higher rate of support for budget-related legislation (56% yea) compared to other categories. Her votes on banking and finance legislation show a more skeptical approach, with 0% support across 3 recorded votes in that category.
Key Positions
By Policy Area
Analysis updated: January 9, 2026
Campaign Finance
Includes all authorized campaign committees (principal committee, joint fundraising, and other authorized committees). Outside spending by Super PACs and independent groups is shown separately below. Verify on FEC.gov →
Career: $12.7M
Fundraising Over Time
Contribution Sources
70%
30%
Individual Breakdown
Itemized (>$200)
$1.3M
Small Dollar (<$200)
$22K
Donation Sizes
Share of individual contribution dollars by donation size, current election cycle.
Where the Money Comes From
Itemized individual contributions only (donations over $200 report the donor's state). Small-dollar donations are not included because the FEC does not itemize them.
Top Contributors
Top Contributing Industries
Top Donor Employers
Employer as self-reported by itemized donors. “Not Employed” and “Self-Employed” typically rank highest for small-dollar campaigns and include retirees.
Where the Money Goes
Spending by Purpose
Purpose categories are self-reported on FEC filings; large “Other” totals are common.
Top Payees
RED HORSE STRATEGIES
DCCC
THE FROST GROUP
KARIS CONSULTING
DITTO CONSULTING INC
FELDMAN, AARON
PAYCHEX
GLOBAL STRATEGY GROUP, LLC
Detailed Breakdown
Expenditures
Operating Costs
$1.6M
Operating Offsets
$352.32
Net Operating
$1.6M
Refunds
Individual Refunds
$9K
Outside Spending (Super PACs)
Supporting
$238K
Opposing
$0
Total Outside Spending
$238K
Top Outside Spenders
WOMEN VOTE!
COMMON SENSE NEW YORKERS INC.
HUMANE SOCIETY LEGISLATIVE FUND
HEROES UNITED PAC, DBA VOLUNTEER FIREFIGHTERS ASSOCIATION, DBA ASSOCIATION OF POLICE & FIRST RESPONDERS
SIERRA CLUB POLITICAL COMMITTEE
PLANNED PARENTHOOD VOTES
SIERRA CLUB INDEPENDENT ACTION
Independent expenditures are made without coordination with the candidate. Source: FEC Schedule E filings.
Voting Record
95 votes across 10 categories