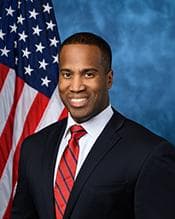
U.S. Representative
John James
Michigan District 10
RepublicanConservative
Contact
U.S. Representative
Michigan District 10
Contact
Voting Profile
Most Active Policy Areas
17
Votes Analyzed
Data sources: voteview, congress.gov
Political Position
John James is a conservative Republican whose voting record places him somewhat more moderate than the average House Republican. His NOMINATE score of 0.314 indicates conservative positions while showing some deviation from the more conservative wing of his party.
More liberal than the average Republican (0.52)
Data source: VoteView NOMINATE scores (UCLA/UC San Diego)
Policy Positions
17
total votes analyzed
Overview
John James is a first-term Republican Representative from Michigan who entered Congress in January 2023. As a relatively new member, his voting record is still developing with only 17 votes on record for analysis. His voting pattern shows strong alignment with Republican procedural positions, consistently voting for previous question motions and party-backed resolutions. His 100% support rate on budget and defense votes suggests traditional conservative priorities in fiscal and military matters. James has shown particular activity in healthcare-related legislation, with 11 votes in this category and a 73% 'yea' rate. This level of engagement may reflect constituent priorities in Michigan or personal policy interests. His position as more moderate than the average Republican could indicate willingness to consider pragmatic solutions on certain issues.
Key Positions
By Policy Area
Analysis updated: January 9, 2026
Campaign Finance
Includes all authorized campaign committees (principal committee, joint fundraising, and other authorized committees). Outside spending by Super PACs and independent groups is shown separately below. Verify on FEC.gov →
Career: $17.1M
Fundraising Over Time
Contribution Sources
13%
85%
2%
Individual Breakdown
Itemized (>$200)
$13K
Small Dollar (<$200)
$22K
Donation Sizes
Share of individual contribution dollars by donation size, current election cycle.
Where the Money Comes From
Itemized individual contributions only (donations over $200 report the donor's state). Small-dollar donations are not included because the FEC does not itemize them.
Top Contributors
Top Contributing Industries
Top Donor Employers
Employer as self-reported by itemized donors. “Not Employed” and “Self-Employed” typically rank highest for small-dollar campaigns and include retirees.
Where the Money Goes
Spending by Purpose
Purpose categories are self-reported on FEC filings; large “Other” totals are common.
Top Payees
JOHN JAMES FOR MI
AMERICAN EXPRESS
CROSBY OTTENHOFF GROUP
SANDLER & ASSOCIATES
ONMESSAGE INC
THE LS GROUP INC.
DICKINSON WRIGHT PLLC
CMDI
Detailed Breakdown
Expenditures
Operating Costs
$332K
Operating Offsets
$2K
Net Operating
$330K
Transfers
Transfers Out
$2K
Refunds
Individual Refunds
$105K
Committee Refunds
$24K
Outside Spending (Super PACs)
Supporting
$2.1M
Opposing
$15.4M
Total Outside Spending
$17.4M
Top Outside Spenders
HMP
EDF ACTION VOTES
AMERICANS FOR PROSPERITY ACTION, INC. (AFP ACTION) DBA CVA ACTION AND DBA LIBRE ACTION
AMERICA PAC
OPPORTUNITY MATTERS FUND, INC.
LCV VICTORY FUND
NRDC ACTION VOTES
WITH HONOR FUND II, INC.
Independent expenditures are made without coordination with the candidate. Source: FEC Schedule E filings.
Voting Record
14 votes across 4 categories