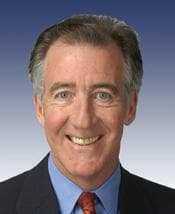
U.S. Representative
Richard E. Neal
Massachusetts District 1
DemocratProgressive
Contact
U.S. Representative
Massachusetts District 1
Contact
Voting Profile
Most Active Policy Areas
332
Votes Analyzed
Data sources: voteview, congress.gov
Political Position
Representative Neal's voting record and ideology score place him in the progressive wing of the Democratic Party, slightly more liberal than the average House Democrat. His long tenure in Congress has seen consistent alignment with Democratic positions on economic and social policy matters.
Near the average for Democrats (-0.38)
Data source: VoteView NOMINATE scores (UCLA/UC San Diego)
Policy Positions
332
total votes analyzed
Overview
Richard Neal has served in the U.S. House of Representatives for over three decades, representing Massachusetts. His voting record reflects a center-left to progressive approach, with particular focus on fiscal policy, healthcare, and economic matters. With 332 recorded votes across multiple policy areas, Neal has demonstrated strong engagement on healthcare legislation, where he has voted on 166 measures with a 46% yea rate, suggesting careful deliberation on specific healthcare proposals rather than uniform support. His budget voting shows higher support at 62%, and defense-related measures receive considerable backing at 80%. As a longtime member of the House, Neal has participated in significant legislative moments spanning multiple administrations. His voting patterns show a willingness to support bipartisan measures in certain areas, particularly defense and some budget matters, while maintaining core Democratic positions on social and economic policy.
Key Positions
By Policy Area
Analysis updated: January 9, 2026
Campaign Finance
Includes all authorized campaign committees (principal committee, joint fundraising, and other authorized committees). Outside spending by Super PACs and independent groups is shown separately below. Verify on FEC.gov →
Career: $32.1M
Fundraising Over Time
Contribution Sources
63%
36%
1%
Donation Sizes
Share of individual contribution dollars by donation size, current election cycle.
Where the Money Comes From
Itemized individual contributions only (donations over $200 report the donor's state). Small-dollar donations are not included because the FEC does not itemize them.
Top Contributors
Top Contributing Industries
Top Donor Employers
Employer as self-reported by itemized donors. “Not Employed” and “Self-Employed” typically rank highest for small-dollar campaigns and include retirees.
Where the Money Goes
Spending by Purpose
Purpose categories are self-reported on FEC filings; large “Other” totals are common.
Top Payees
AMERICAN EXPRESS
DCCC
CHECKWRITERS PAYROLL
C&G ASSOCIATES
BRENDAN NEAL STRATEGIES LLC
INTERNAL REVENUE SERVICE
DAPA RESEARCH, INC.
HALL, MICHAEL F.
Detailed Breakdown
Expenditures
Operating Costs
$187K
Outside Spending (Super PACs)
Supporting
$747K
Opposing
$1.7M
Total Outside Spending
$2.4M
Top Outside Spenders
JUSTICE DEMOCRATS PAC
FIGHT CORPORATE MONOPOLIES
AMERICAN HOSPITAL ASSOCIATION PAC
INDIVISIBLE ACTION
NATIONAL ASSOCIATION OF REALTORS POLITICAL ACTION COMMITTEE
AMERICAN COLLEGE OF RADIOLOGY ASSOCIATION PAC
AMERICAN WORKING FAMILIES
INTERNATIONAL ASSOCIATION OF SHEET METAL, AIR, RAIL AND TRANSPORTATION WORKERS POLITICAL ACTION LEAGUE
Independent expenditures are made without coordination with the candidate. Source: FEC Schedule E filings.
Voting Record
321 votes across 13 categories